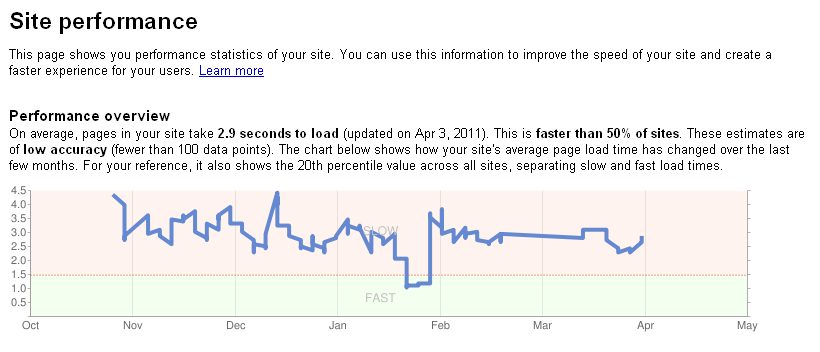
I’ve written a few tutorials lately on how to reduce page load times. While I use Google’s Page Speed Firefox/Firebug plugin for evaluating pages for load times, there are times when I want a second opinion, or want to point a client to a tool. This post is a collection of links to online tools for testing web page performance.
Page Speed Online
http://pagespeed.googlelabs.com/
Google’s wonderful Page Speed tool, once only available as a Firefox browser Add-on, finally arrives as an online tool. Achieving a high score (ardamis.com is a 96/100) should be on every web developer’s list of things to do before the culmination of a project.
Enter a URL and Page Speed Online will run performance tests based on a set of best practices known to reduce page load times.
- Optimizing caching – keeping your application’s data and logic off the network altogether
- Minimizing round-trip times – reducing the number of serial request-response cycles
- Minimizing request overhead – reducing upload size
- Minimizing payload size – reducing the size of responses, downloads, and cached pages
- Optimizing browser rendering – improving the browser’s layout of a page
WebPagetest
http://www.webpagetest.org/
WebPagetest is an excellent application for users who want the same sort of detailed reporting that one gets with Page Speed.
- Load time speed test on first view (cold cache) and repeat view (hot cache), first byte and start render
- Optimization checklist
- Enable keep-alive, HTML compression, image compression, cache static content, combine JavaScript and CSS, and use of CDN
- Waterfall
- Response headers for each request
Load Impact
http://loadimpact.com/pageanalyzer.php
Load Impact is an online load testing service that lets you load- and stress test your website over the Internet. The page analyzer analyzes your web page performance by emulating how a web browser would load your page and all resources referenced in it. The page and its referenced resources are loaded and important performance metrics are measured and displayed in a load-bar diagram along with other per-resource attributes such as URL, size, compression ratio and HTTP status code.
ByteCheck
http://www.bytecheck.com/
ByteCheck is a super minimal site that return your page’s all-important time to first byte (TTFB). Time to first byte is the time it takes for a browser to start receiving information after it has started to make the request to the server, and is responsible for a visitor’s first impression that a page is fast- or slow-loading.
Web Page Analyzer
http://websiteoptimization.com/services/analyze/
My opinion is that the Web Page Analyzer report is good for beginners without much technical knowledge of things like gzip compression and Expires headers. It’s a bit dated, and is primarily concerned with basics like how many images a page contains. It tells you how fast you can expect your page to load for dial-up visitors, which strikes me as quaint and not particularly useful.
- Total HTTP requests
- Total size
- Total size per object type (CSS, JavaScript, images, etc.)
- Analysis of number of files and file size as compared to recommended limits
The Performance Grader
http://www.joomlaperformance.com/component/option,com_performance/Itemid,52/
This is another simplistic analysis of a site, like Web Page Analyzer, that returns its analysis in the form of pass/fail grades on about 14 different tests. I expect that it would be useful for developers who want to show a client a third-party’s analysis of their work, if the third-party is not terribly technically savvy.
One unique thing about this tool, though, is that it totals up the size of all images referenced in CSS files (even those that the current page isn’t using).
- HTML Size
- Total Size
- Total Requests
- Generation Time
- Number of Hosts
- Number of Images
- Size of Images
- Number of CSS Files
- Size of CSS Files
- Number of Script Files
- Size of Script Files
- HTML Encoding
- Valid HTML
- Frames

